Introduction to the 8 queens puzzle
The eight queens puzzle is the problem of placing eight chess queens on an 8×8 chessboard so that no two queens threaten each other.
The wikipedia page is a good starting resource.
This post contains:
- A neat version of a recursive function for finding all solutions:
place_queen() - A manually minified version that fits in a tweet (including generating a plot)
Recursive solution in R
library(tidyverse)

#-----------------------------------------------------------------------------
#' Try and place a queen given the queens we have on the board so far.
#'
#' This function calls itself iteratively for every valid placement of the
#' next queen.
#'
#' @param queens A vector of integers representing the column placement
#'               of queens so far. The index within this list
#'               is the row, and the value is the column.
#'
#'  e.g. queens = c(1, 4, 7) corresponds to
#'
#'
#'  ---------------------------------
#'  |   |   |   |   |   |   |   |   |
#'  ---------------------------------
#'  |   |   |   |   |   |   |   |   |
#'  ---------------------------------
#'  |   |   |   |   |   |   |   |   |
#'  ---------------------------------
#'  |   |   |   |   |   |   |   |   |
#'  ---------------------------------
#'  |   |   |   |   |   |   | Q |   |    3rd row, 7th column
#'  ---------------------------------
#'  |   |   |   | Q |   |   |   |   |    2nd row, 4th column
#'  ---------------------------------
#'  | Q |   |   |   |   |   |   |   |    1st row, 1st column
#'  ---------------------------------
#'
#'
#'
#'
#' @return a list of length 92. Each list element is a vector of 8 integers
#'         i.e. a solution to the 8 queens problem
#-----------------------------------------------------------------------------
place_queen <- function(queens=c()) {
  # If there are 8 queens placed, then this must be a solution.
  if (length(queens) == 8) {
    return(list(queens))
  }

  # Figre out where a queen can be placed in the next row.
  # Drop all columns that have already been taken - since we
  # can't place a queen below an existing queen
  possible_placements <- setdiff(1:8, queens)

  # For each queen already on the board, find the diagonal
  # positions that it can see in this row.
  diag_offsets <- seq.int(length(queens), 1)
  diags <- c(queens + diag_offsets, queens - diag_offsets)
  diags <- diags[diags > 0 & diags < 9]

  # Drop these diagonal columns from possible placements
  possible_placements <- setdiff(possible_placements, diags)

  # For each possible placement, try and place a queen
  possible_placements %>%
    map(~place_queen(c(queens, .x))) %>%
    keep(~length(.x) > 0) %>%
    flatten()
}


#-----------------------------------------------------------------------------
#' Plot a single solution
#' @param queens a vector of 8 integers giving the column positions of 8 queens
#-----------------------------------------------------------------------------
plot_single_8queens <- function(queens) {
  queens_df <- data_frame(cols = queens, rows=1:8)
  board_df <- expand.grid(cols = 1:8, rows = 1:8) %>%
    mutate(check = (cols + rows) %%2 == 1)

  ggplot(queens_df, aes(cols, rows)) +
    geom_tile(data=board_df, aes(fill=check), colour='black') +
    geom_label(label='Q', fill='lightblue') +
    theme_void() +
    coord_equal() +
    scale_fill_manual(values = c('TRUE'='white', 'FALSE'='black')) +
    theme(
      legend.position = 'none'
    ) +
    labs(title = paste("Queens", deparse(as.numeric(queens))))

}


#-----------------------------------------------------------------------------
# Start with no queens placed and generate all solutions. Plot the first 2
#-----------------------------------------------------------------------------
solutions <- place_queen()
do.call(rbind, solutions) %>%
as.data.frame() %>%
head(10) %>%
knitr::kable(caption="First 10 solutions (Each row is a solution)")| V1 | V2 | V3 | V4 | V5 | V6 | V7 | V8 |
|---|---|---|---|---|---|---|---|
| 1 | 5 | 8 | 6 | 3 | 7 | 2 | 4 |
| 1 | 6 | 8 | 3 | 7 | 4 | 2 | 5 |
| 1 | 7 | 4 | 6 | 8 | 2 | 5 | 3 |
| 1 | 7 | 5 | 8 | 2 | 4 | 6 | 3 |
| 2 | 4 | 6 | 8 | 3 | 1 | 7 | 5 |
| 2 | 5 | 7 | 1 | 3 | 8 | 6 | 4 |
| 2 | 5 | 7 | 4 | 1 | 8 | 6 | 3 |
| 2 | 6 | 1 | 7 | 4 | 8 | 3 | 5 |
| 2 | 6 | 8 | 3 | 1 | 4 | 7 | 5 |
| 2 | 7 | 3 | 6 | 8 | 5 | 1 | 4 |
plot_single_8queens(solutions[[1]])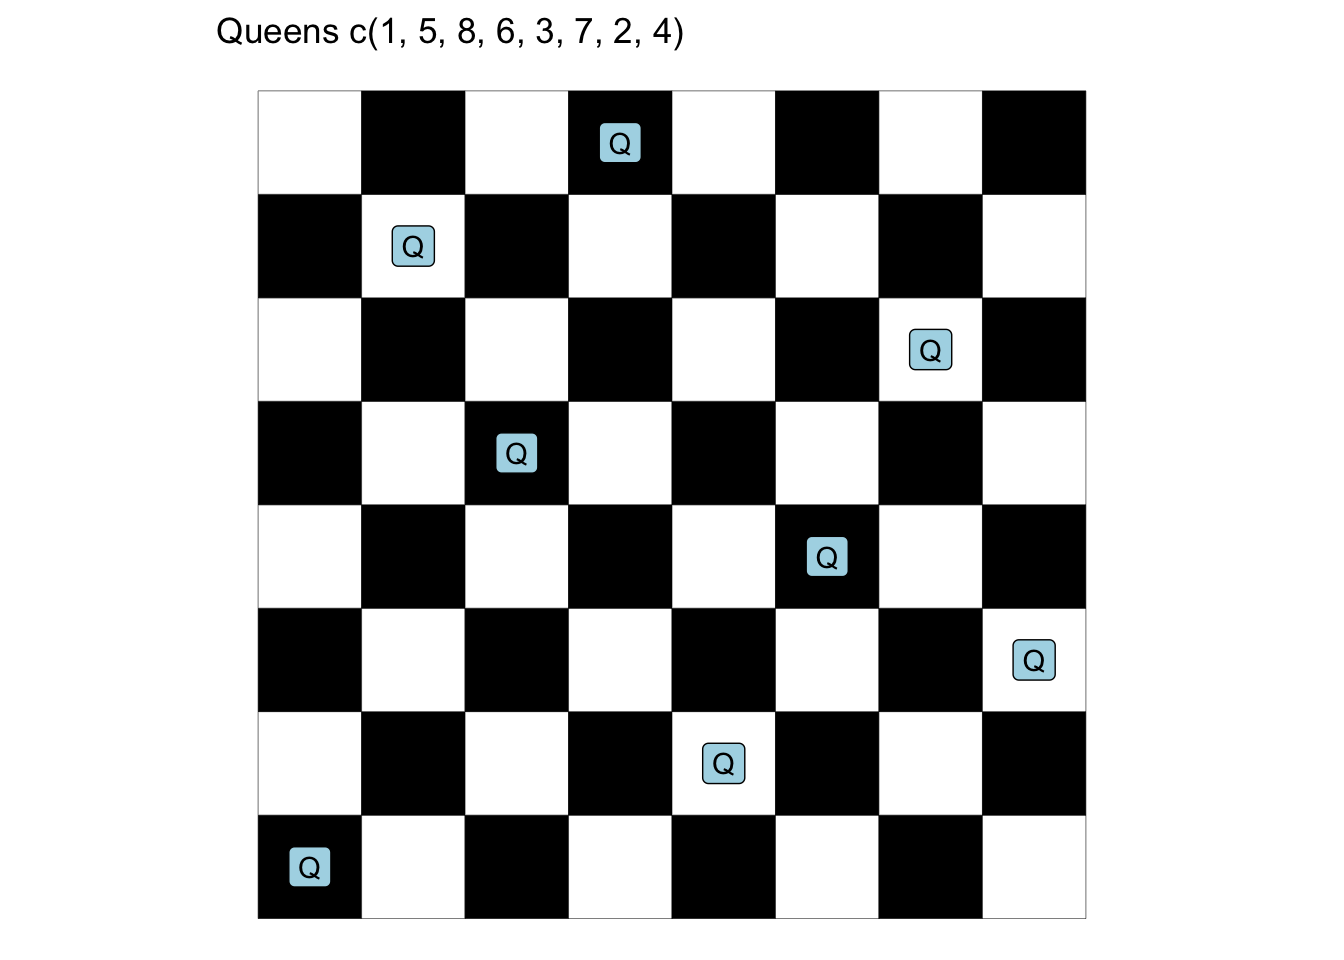
plot_single_8queens(solutions[[2]])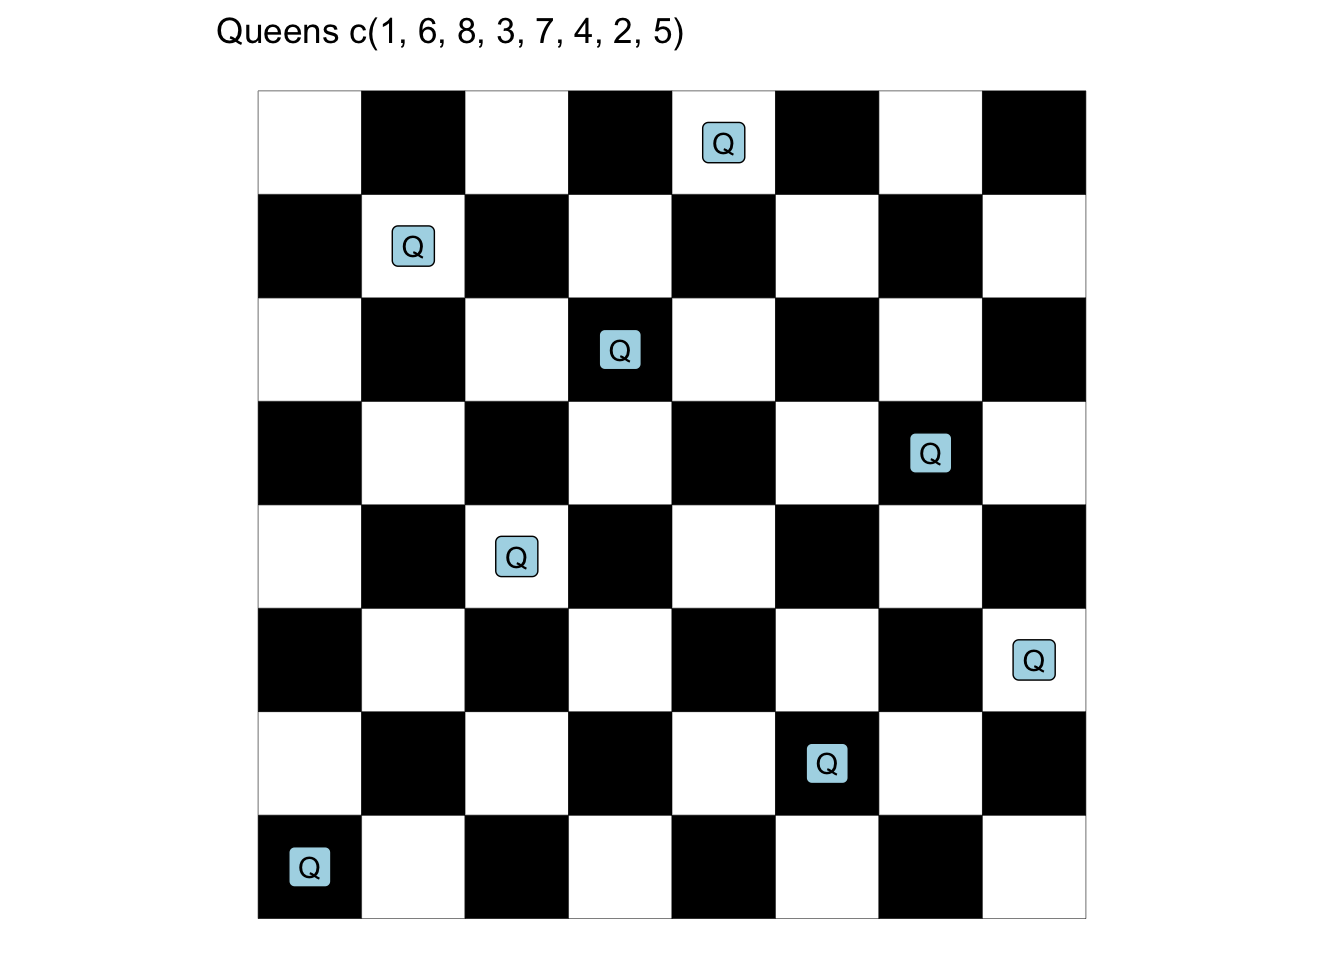
8Queens solution in Rstats Compacted into a tweet
This tweet calculates all 92 solutions and plots them on a checkered board - the bright blue squares on the board represent the locations of the queens.
This solution is exactly 280 characters and fits in a tweet!
library(tidyverse)
v=1:8
f=function(q){L=length(q)
if(L==8){q}else{flatten(map(setdiff(v,c(q,q+L:1,q-L:1)),~f(c(q,.x))))}}
s=data.frame(c=unlist(f(c())),r=v,x=rep(1:92,e=8),z=4)
b=mutate(crossing(c=v,r=v),z=(c+r)%%2)
g=geom_tile
ggplot(s,aes(r,c,fill=z))+g(d=b)+g()+facet_wrap(~x)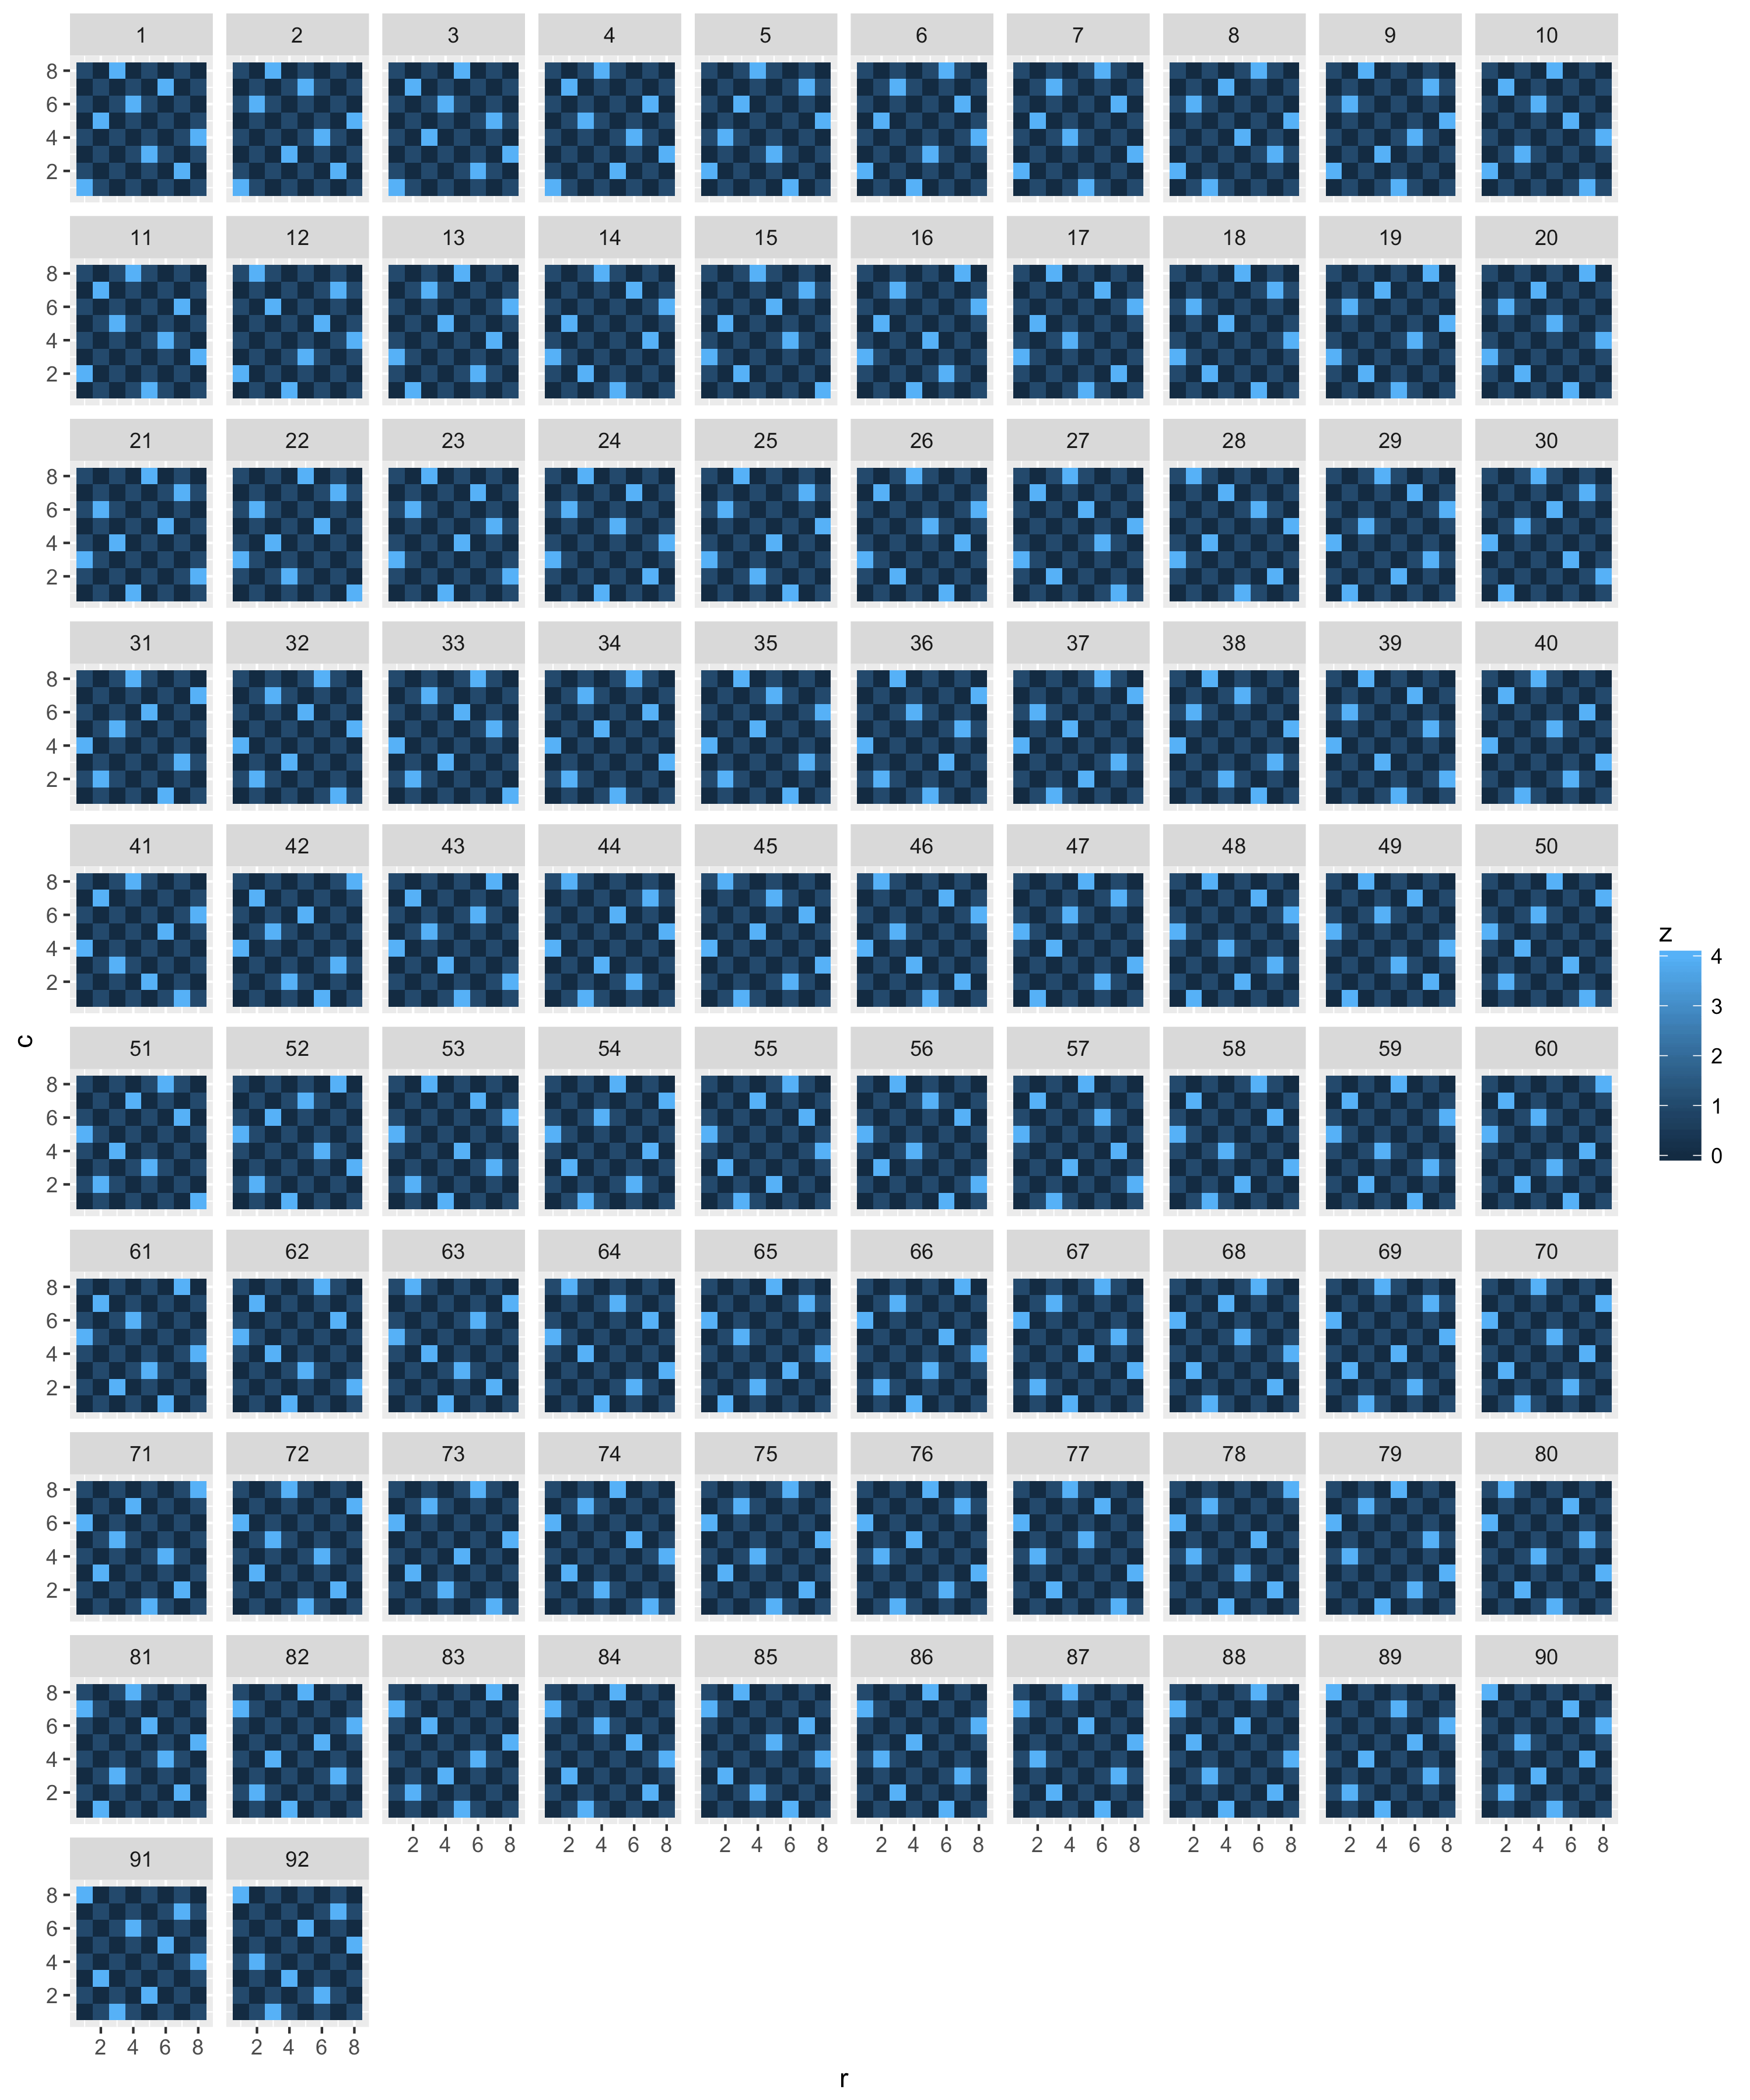
Extension
Nothing else to do :)

Share this post
Twitter
Google+
Facebook
Reddit
LinkedIn
StumbleUpon
Pinterest
Email