Messing around with chull
As mentioned previously ( 1, 2, 3 ) I’m attempting to use chull() to create some stuff.
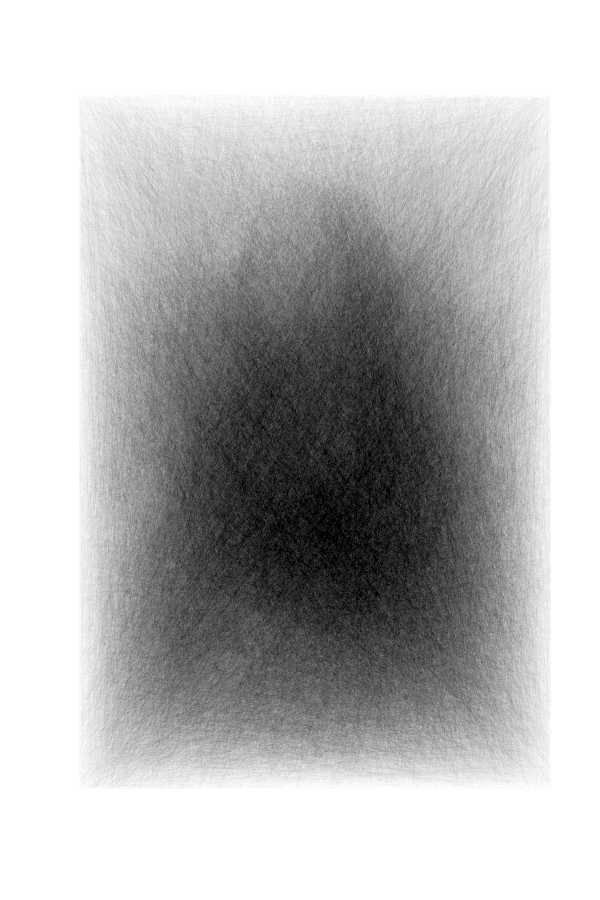
I had though that using convex hulls would give me some nicer medium-scale circular artefacts in the image, but that didn’t occur.
Instead, just using the random points sampled from the image to draw a very long line was sufficient to produce an almost equivalent image (and about 1000x faster as well!)
The new line scheme is:
- Generate a large number of points somehow
- Sample points from the image (with darker pixels having a higher probability of being sampled)
- Draw the line connecting all these points
Final image using lines rather than convex hulls

Code
#-----------------------------------------------------------------------------
# Read a jpg file using image magick and scale it and convert to greyscale
#-----------------------------------------------------------------------------
filename <- 'data/mona.jpg'
im <- magick::image_read(filename) %>%
  magick::image_convert(type='grayscale') %>%
  magick::image_scale(geometry="75%") %>%
  magick::image_flip()

#-----------------------------------------------------------------------------
# Extract just the numeric matrix representing the image.
#-----------------------------------------------------------------------------
m <- magick::as_EBImage(im)@.Data


#-----------------------------------------------------------------------------
# Set up plot configuration
#-----------------------------------------------------------------------------
par(mar = c(0, 0, 0, 0))

xlim          <- c(0, dim(m)[1])
ylim          <- c(0, dim(m)[2])
w             <- 4
h             <- 6
dpi           <- 150


#-----------------------------------------------------------------------------
# Choose random points, but weighted by the 'opposite' of their colour value
# i.e. Prefer to choose the darker points over the lighter points.
#-----------------------------------------------------------------------------
# nobjects <-    300; col <- '#000000ff'
nobjects <- 100000; col <- '#00000002'

plot_indices <- sample(seq(m), size = nobjects, prob = (1-m)^2, replace = TRUE)
plot_points  <- arrayInd(plot_indices, .dim=dim(m))


#-----------------------------------------------------------------------------
# Plot lines and save
#-----------------------------------------------------------------------------
plot_filename <- sprintf("plot/plot_%06i.png", nobjects)
withr::with_png(plot_filename, width=w*dpi, height=h*dpi, {
  plot(1, type="n", xlab="", ylab="", xlim=xlim, ylim=ylim, asp=1, ann=FALSE,
       axes = FALSE, frame.plot = FALSE)

    lines(plot_points, col=col)
})
cool but useless
Mostly R.
/
Categories
Share this post
Twitter
Google+
Facebook
Reddit
LinkedIn
StumbleUpon
Pinterest
Email